Remember market corrections? They are happening faster.

Well things have sure accelerated quickly. My previous post outlining the resiliency of the market debuts and almost immediately becomes old news. Markets have turned down sharply in just the last few sessions. What are we to make of it?

If we specifically look at just Monday, we see price movement that looks like a year-long chart, not a daily chart. The S&P 500 was down 4% only to rally back to positive territory. ARKK (a fund with a heavy technology focus) was nearly down double digits before ending the up nearly 3%.

Does this all seem a bit…fast? You are not alone. As Jim Bianco pointed out, the S&P 500 has only recovered from an intraday loss of 4% only three times since 1977: October 16, 2008, October 23, 2008, and Monday (January 24, 2022). Whenever price movement is mentioned in the same breath as October 2008, we can probably assume it is historic.
At the beginning of the pandemic, the S&P 500 lost about 34% between late February 2020 and late March 2020, the fastest 30% stock market decline ever. But by August, it was reaching new all-time highs.
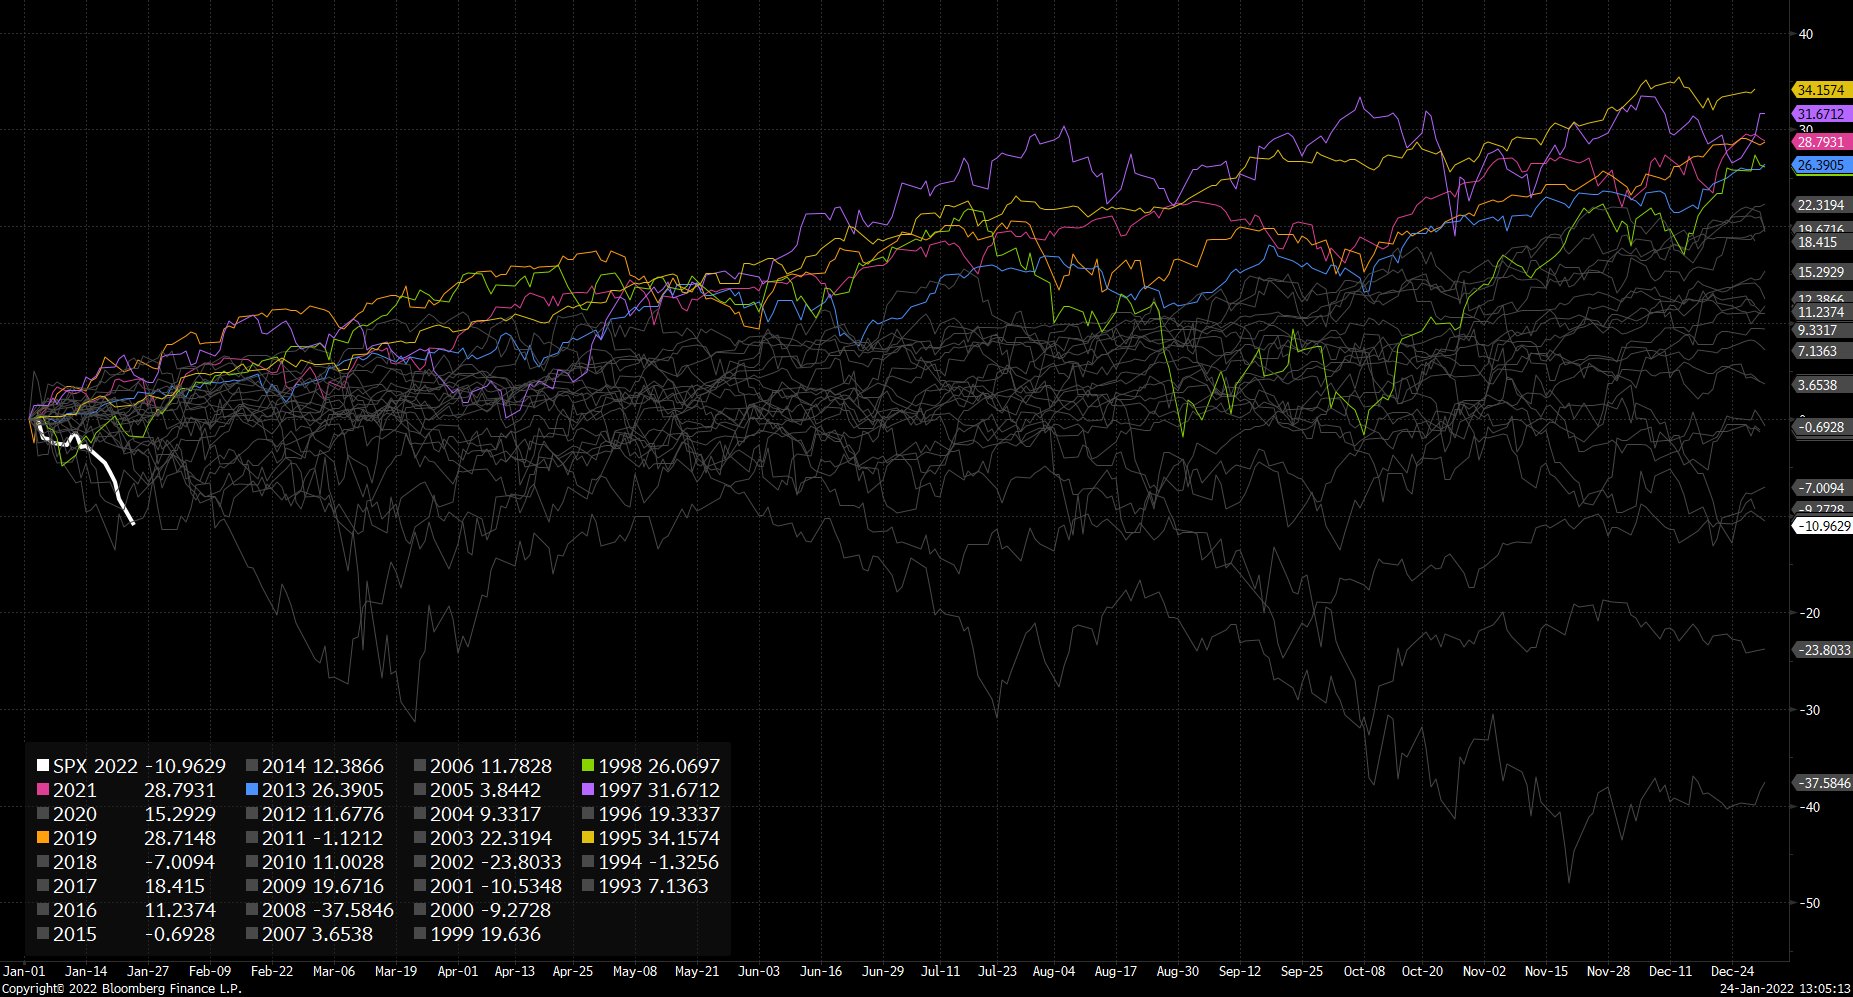
Fast forward to today and the S&P 500 has had the second fastest -10% decline ever to start a year. Check out this chart from Michael McDonough on Twitter:

So if we add all this up, it seems safe to conclude that markets are moving faster than ever. So what can we investors do about it? Plan accordingly. Keep a “shopping list” for when these flash drawdowns occur. Attempt to rebalance your portfolio when shorter term price movements throw your allocations off-track. And if this all seems like too much work to you, consider working with a financial professional who can do the heavy lifting for you.
We can help with that.
Charts and data used in this blog post were found at Today’s Markets (koyfin.com).

Those intra-day movements are wild! Good perspective. As the saying goes…time in the market is more important than timing the market.